Table Of Contents
Open Table Of Contents
Intro
You might heard of debugging before but what is anti-debugging?
Anti-debugging is a security technique used by software developers and malware authors to detect if a program is running under the control of a debugger. It aims to prevent reverse engineering, analysis, or tampering by causing the application to behave differently, crash, or terminate if a debugger is detected.
At the machine level, debugging and anti-debugging are not abstract ideas. They are direct battles over execution control, observability, and trust. A debugger exists to observe and manipulate a running program, while anti-debugging exists to detect, resist, mislead, or punish that observation.
Understanding anti-debugging without proper understanding of debugging internals is impossible. Therefore, we start from first principles.
Quick Recap Of Debugging
Debugging is the act of external execution control.
A debugger does not run inside the program it debugs. It runs alongside it. The debugged program (“debuggee”) is placed into a special execution mode where these features can be carried out.
- Execution may be stopped arbitrarily
- Register state can be read or modified
- Memory can be inspected or rewritten
- System events are forwarded to the debugger
The debugger has power while the debuggee does not consent. This asymmetry is precisely what anti-debugging attempts to detect or break.
Debugging In OS Level
On Linux, debugging is built primarily on:
- ptrace()
- /proc filesystem
- Signals (e.g. SIGTRAP)
ptrace(), for example, allows one process to attach to another process, intercept syscalls, receive notifications on execution events, read/write registers and memory, etc. Once a process is being traced, the kernel knows it and execution semantics subtly change. This change is a major anti-debugging attack surface.
On Windows, debugging relies on:
- Debug objects
- Structured Exception Handling (SEH)
- Debug ports
- NT kernel APIs
When a process is debugged, the kernel delivers debug events and exceptions behave differently. Certain APIs might return altered values.
One important thing to note is that the OS cannot fully hide the presence of a debugger.
So, What Is Anti-Debugging?
Anti-debugging is a collection of techniques:
- Detect debugger presence
- Exploit debugger side effects
- Interfere with debugger control
- Mislead or punish analysis
It operates at multiple layers like User-mode, Kernel-mode, CPU-level, Environmental, etc.
Anti-debugging does not stop execution. Rather, it attempts to stop understanding.
What Is The Purpose Of It?
Some key areas where anti-debugging is used include:
- Malware & Ransomware: To stop, delay, or crash analysis tools, preventing researchers from understanding how the threat works.
- Software Protection (DRM): To stop attackers from debugging software to bypass licensing, license checks, or crack protections.
- Game Security: To prevent cheaters from using debuggers to modify game memory, inject code, or find vulnerabilities.
- Mobile App Security: To protect intellectual property in Android/iOS apps by preventing API hooking and runtime analysis.
As for now, I assume you get the idea of the basic concept about debugging and anti-debugging. Time to get some hands-on.
Practical Anti-Debugging In C
We will build a C program (in Linux) that performs multiple anti-debugging checks.
Compare with many resources out there, this code seems pretty basic but the point is to equip you with the knowledge of how anti-debugging works in the wild. I strongly recommend you to do more research or write your own code on this topic if you want to get more practical exercises.
Here’s the code we’ll be using:
#define _GNU_SOURCE
#include <stdio.h>
#include <stdlib.h>
#include <sys/ptrace.h>
#include <errno.h>
#include <string.h>
#include <unistd.h>

/* Anti-debug: ptrace */
int check_ptrace(void) {
        errno = 0;
        if (ptrace(PTRACE_TRACEME, 0, NULL, NULL) == -1) {
                return 1; // Debugger detected
        }
        return 0; // No debugger
}

/* Anti-debug: /proc */
int check_tracerpid(void) {
        FILE *f = fopen("/proc/self/status", "r");
        if (!f) return 0;

        char line[256];
        while (fgets(line, sizeof(line), f)) {
                if (strncmp(line, "TracerPid:", 10) == 0) {
                        int pid = atoi(line + 10);
                        fclose(f);
                        return pid != 0;
                }
        }
        fclose(f);
        return 0;
}

/* Protected logic */
int secret_logic(int x) {
        return (x * 3) ^ 0x55;
}


int main(void) {
        int debugged = 0;
        debugged |= check_tracerpid(); // A bitwise OR operation (0 OR 0, 0 OR 1)
        debugged |= check_ptrace(); // A bitwise OR operation (0 OR 0, 0 OR 1)

        if (debugged) {
                /* Mislead instead of crashing */
                puts("Running in restricted mode...");
                printf("Result: %d\n", secret_logic(1));
                return 0;
        }

        /* Normal execution */
        puts("Normal execution mode...");
        printf("Result: %d\n", secret_logic(42));
        return 0;
}
This code uses multiple anti-debugging checks and lies when a debugger is detected. It behaves differently under GDB.
Self-Ptrace Detection process can attempt to trace itself. If this fails, it usually means a debugger is already attached and the kernel denies multiple tracers.
/proc-Based Detection exposes process state through the /proc filesystem. When a process is being debugged, /proc/self/status contains “TracerPid”. If TracerPid is non-zero, a debugger is attached.
Let’s compile it:
gcc anti_debug.c -o anti_debug -no-pie -fno-stack-protector -O0-O0 : No Optimization. (Used to ensure that the compiled code closely matches the source code for an optimal debugging experience)
-no-pie: Not to produce a Position Independent Executable (PIE). (Used to cause the resulting executable to be loaded at a fixed memory address, rather than a randomized one)
-fno-stack-protector: Disable the compiler’s built-in security feature that protects against stack buffer overflows.
Run it normally (No debugger):
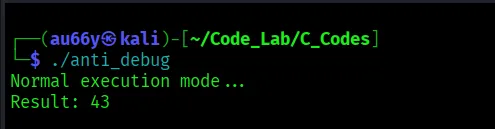
This is the correct behavior.
Debug with GDB:
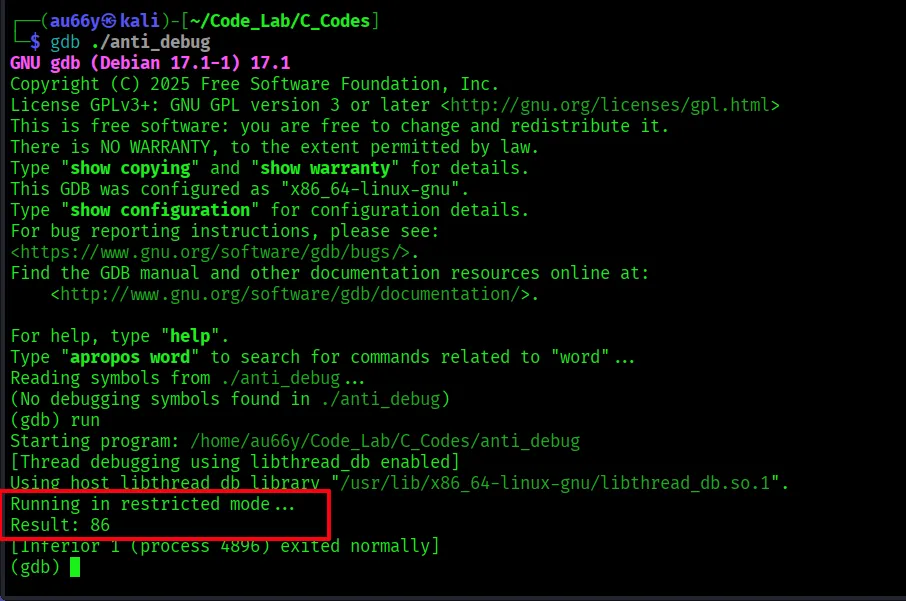
Ha! Behavior changed!
Bypassing Anti-Debugging
Now comes the fun part. We will bypass the anti-debugging logic so that the program always runs normal execution even under GDB.
This time, let’s use a versatile command-line tool, radare2.
Open the binary with ‘-w’ to allow writing (patching) and run full analysis by ‘aaa’:
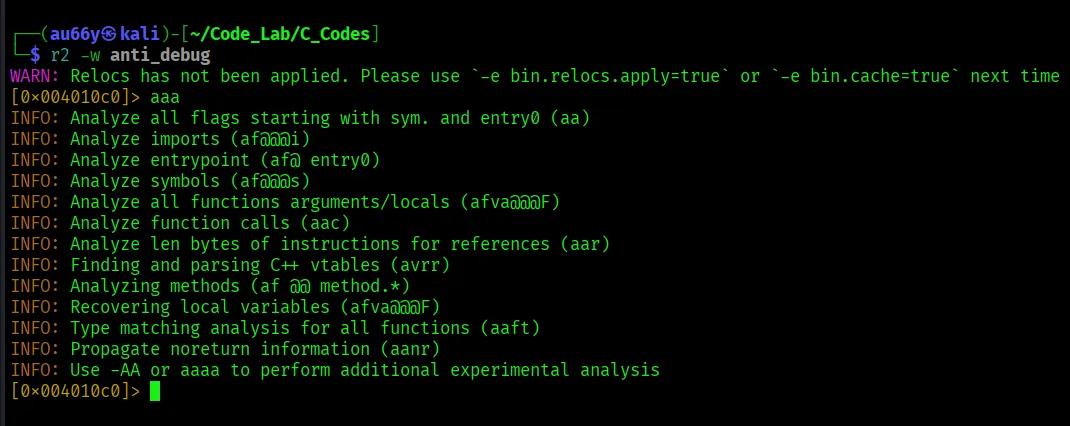
This finds functions, detects control flow and identifies main(). Then find it with the command ‘afl’.
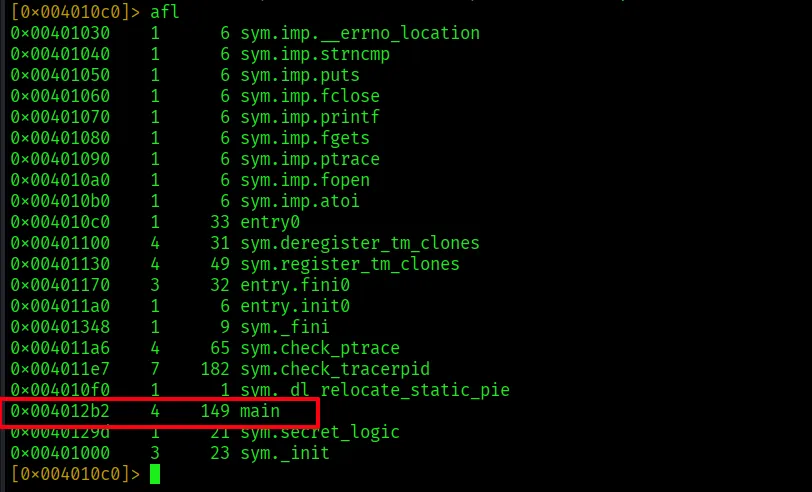
We found main() in the address 0x4012b2. Seek to it by ‘s main’ and switch to assembly view with ‘pdf’, which stands for Print Disassemble Function:

Here we see the je command, meaning jump if debugger is not detected.
To patch the instruction, we first need to seek to the instruction and check with ‘pd’ (print disassembly):
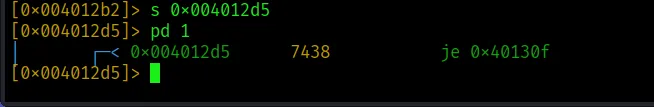
It’s indeed our designated instruction. Now patch with ‘wa’ (write assembly) and check again with ‘pd’:
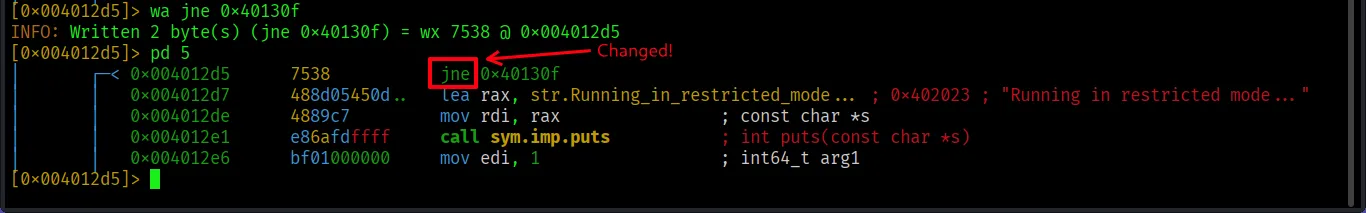
Quit and save with ‘q’. Since we opened with ‘-w’, changes are already saved.
Let’s test with GDB again.
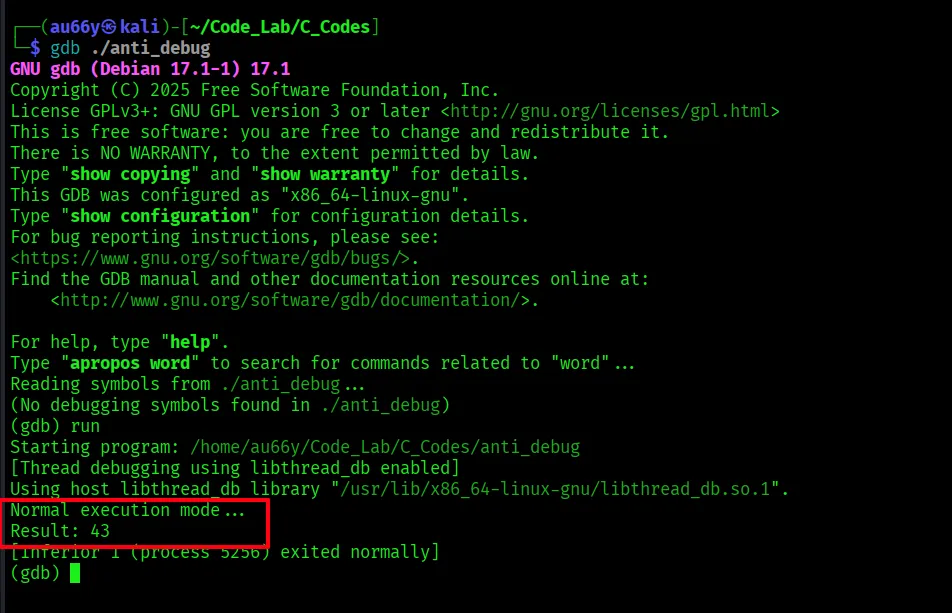
Wow! Anti-debugging destroyed!
Conclusion
Now that you might already figure out, no anti-debugging techniques can make reverse engineering completely impossible. Because if a program can run on a machine, it can be analyzed.
Anti-debugging is designed to stop script kiddies or amateur crackers, but not to fully prevent a professional reverse engineer from eventually analyzing the software.
If you’re a skilled reverse engineer, the code and the technique used in this post will be ridiculous to you.
But if you’re a starter or a curious learner like me, we should elevate our skills constantly, find new ways and methods so that the only way to make codes truly safe from us is to not run it on the client side at all (i.e. keep it as a server-side service)
Happy Reversing!
References and Resources
Reverse Engineering Anti-Debugging Techniques (by John Hammond and Nathan Baggs)
How to Bypass anti-debugging advance (by Ali Saifeldin)
https://medium.com/@alisaifaldeen/how-to-bypass-anti-debugging-advance-2a1c9384f45d
For Low-Level knowledge:
For books:
Although we haven’t use Ghidra in this post, I strongly recommend: