Table of Contents
Open Table of Contents
What is the Heap?
You’ve probably heard:
“The heap is where dynamic memory lives.”
Fair enough. But let’s break that down like an expert.
The stack is for short-term, automatic storage which disappears after function calls.
The heap is long-term memory your program asks for manually and must clean up manually too.
In C, you allocate heap memory like this:
int *arr = malloc(10 * sizeof(int));And when you’re done:
free(arr)It’s up to you, the programmer, to manage it or leave heap leaks, dangling pointers, or even exploitable bugs.
How the Heap Actually Works (No Analogies)
The heap is a big chunk of memory managed by a piece of code called the heap allocator. On Linux, it’s usually part of glibc specifically ptmalloc (based on dlmalloc).
When you call malloc(), here’s what actually happens:
- Your program asks the allocator for memory.
- If there’s free space in the heap area, it gives you a pointer.
- If not, it requests more space from the OS ( using brk() or mmap() ).
And that memory is surrounded by metadata: size, flags, free/used info, and links to other chunks.
Time to get Hands-on
We’ll write a very simple C program that allocates a small amount of memory on the heap, writes some data to it, and then frees it.
Create a file named heap.c.
// heap.c
#include <stdio.h>
#include <stdlib.h>
#include <string.h>
int main() {
printf("Starting the program.\n");
printf("The 'sbrk(0)' program break is at: %p\n", sbrk(0));
// Allocate 16 bytes of memory on the heap
char *p1 = (char *)malloc(16);
printf("--- After first malloc(16) ---\n");
printf("p1 (start of our usable memory) is at address: %p\n", p1);
printf("The program break is now at: %p\n", sbrk(0));
// Let's write some data into our allocated memory
strcpy(p1, "hello heap!");
// Allocate another 24 bytes
char *p2 = (char *)malloc(24);
printf("\n--- After second malloc(24) ---\n");
printf("p2 is at address: %p\n", p2);
printf("The program break is now at: %p\n", sbrk(0));
strcpy(p2, "another allocation");
printf("\n--- Before freeing ---\n");
printf("Content of p1: %s\n", p1);
printf("Content of p2: %s\n", p2);
// Free the first allocation
free(p1);
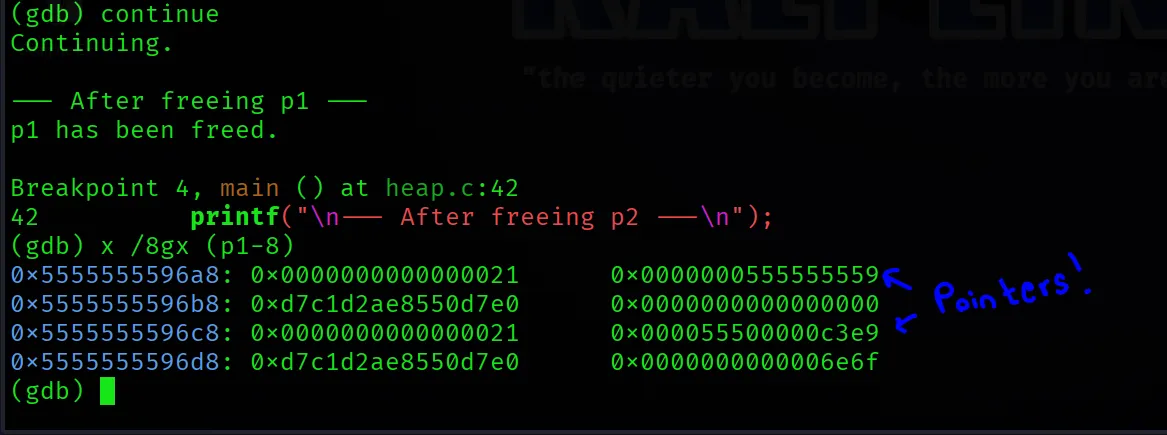
printf("\n--- After freeing p1 ---\n");
printf("p1 has been freed.\n");
// Free the second allocation
free(p2);
printf("\n--- After freeing p2 ---\n");
printf("p2 has been freed.\n");
printf("Program finished.\n");
return 0;
}A quick note on sbrk(0): This is a system call that adjusts the “program break”, which is the top end of the process’s data segment. Calling sbrk(0) doesn’t change anything; it just returns the current location of the program break. malloc often uses sbrk behind the scenes to request memory from the OS, so watching this value change is a great way to see the heap grow.
To use GDB effectively, we need to compile our program with debugging information. The -g flag tells the GCC compiler to do this.
Open your terminal and run:
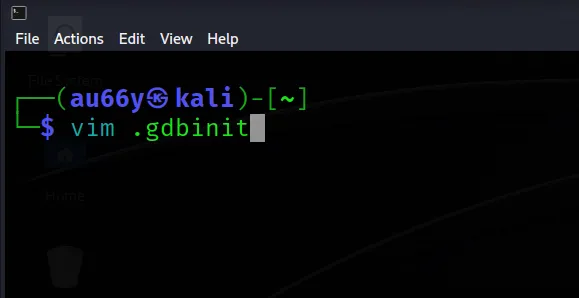
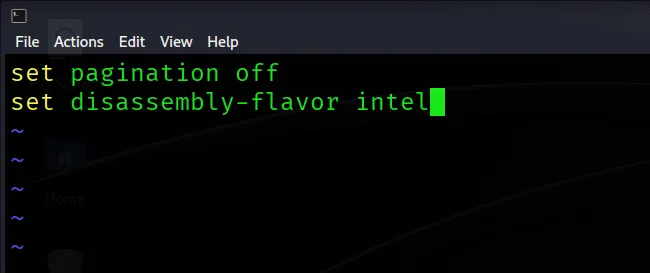
gcc -g -o heap heap.cNow, let’s launch our program inside GDB. Before we do that, we’ll create .gdbinit file in home directory to run the commands automatically every time we open GDB.
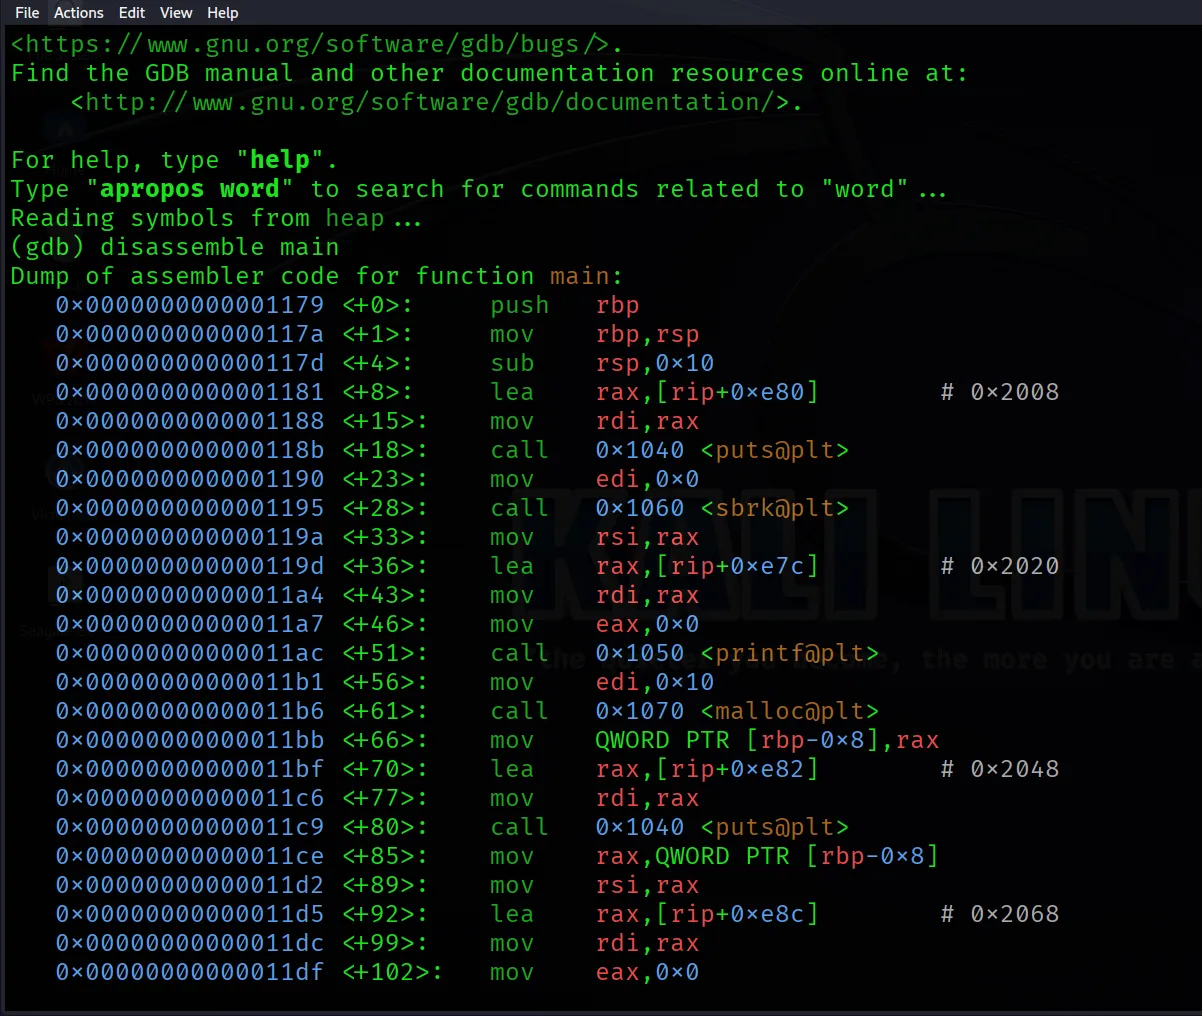
Now, let’s launch our program inside GDB.
gdb heapAnd we see commands are working.
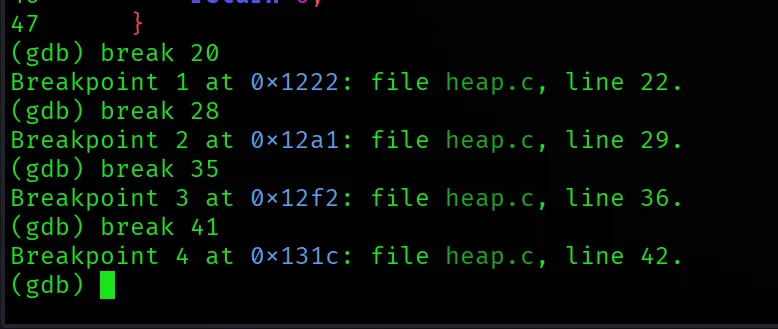
We want to stop the program at key moments to inspect the state of memory. Let’s set breakpoints right after each malloc call and after the free calls.
First, let’s see our code in GDB with list command:
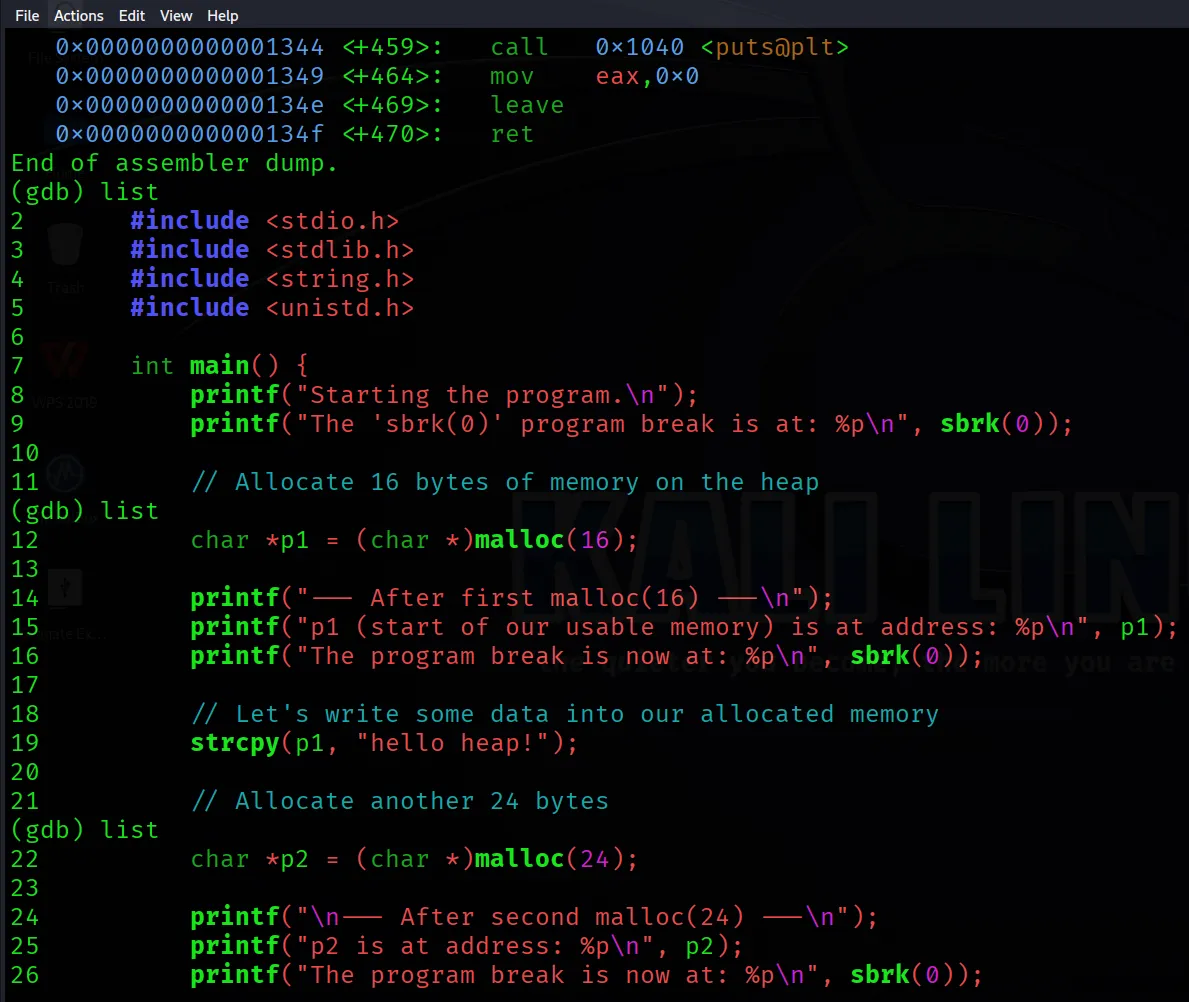
You’ll see your C source code with line numbers. Now set the breakpoints. Let’s say the lines are:
- p1 = malloc(16) is on line 19.
- p2 = malloc(24) is on line 27.
- free(p1) is on line 34.
- free(p2) is on line 40.
Set breakpoints on the lines after these calls.
Now, run the program.
(gdb) runThe program will start and then stop at our first breakpoint.
The program has stopped after malloc(16) was called. Let’s investigate!
-
Find the Pointer Address: p1 now holds the address of the memory malloc gave us. Let’s print it.
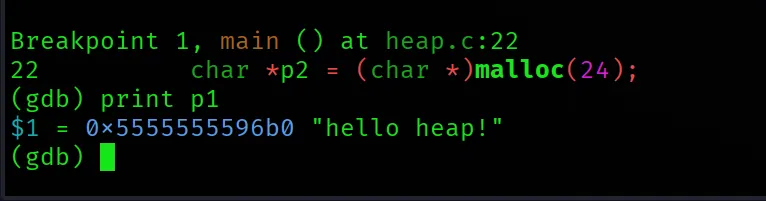
-
Examine the Memory: Let’s look at the memory at that address. The x command in GDB stands for “examine”. The syntax is
x/<N><F><S>address.
- N: How many units to display.
- F: Format (e.g., x for hex, s for string, c for char).
- S: Size (b for byte, h for half-word, w for word (4 bytes), g for giant word (8 bytes on x86-64)).
Let’s view 32 bytes as a string starting at p1: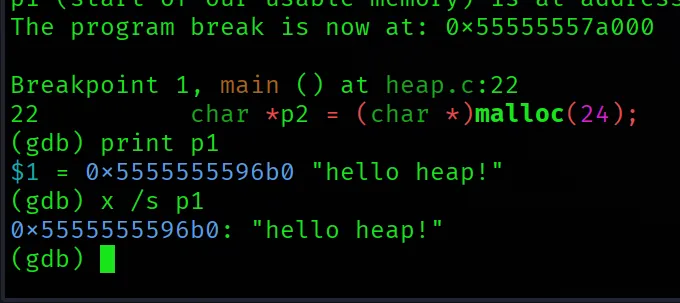 This confirms strcpy worked.
- The Hidden Metadata: Here is the most important part. malloc needs to store some information about the allocation (like its size) for free to work correctly. This metadata is stored right before the memory address it gives you!
The memory allocated by malloc is organized into “chunks”. Each chunk has a header followed by the user’s data. On a 64-bit system, the header is typically 8 or 16 bytes. Let’s examine the 8 bytes before our pointer p1.
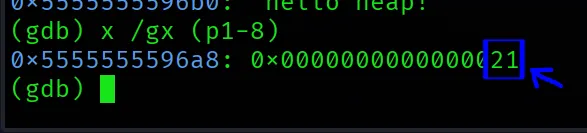
This is the magic number! What is 0x21?
The size of the chunk is encoded in the upper bits. 0x20 bytes is 32 bytes. We only asked for 16, but malloc rounded up to the next alignment boundary (16 bytes) and added 8 bytes for its own header, so 16 (user) + 8 (header) is not quite right. The total chunk size must be a multiple of 16 bytes for alignment, so the smallest chunk that can hold 16 bytes of user data is 32 bytes total. So, 0x20 is the size.
The last 3 bits are flags. The last bit (1) is the PREV_INUSE flag. It means the previous adjacent chunk in memory is currently in use. So 0x20 + 0x1 = 0x21. You have just seen the heap chunk header!
Let’s continue to the next breakpoint.
(gdb) continueThe program stops after malloc(24).
Print the new pointer p2:
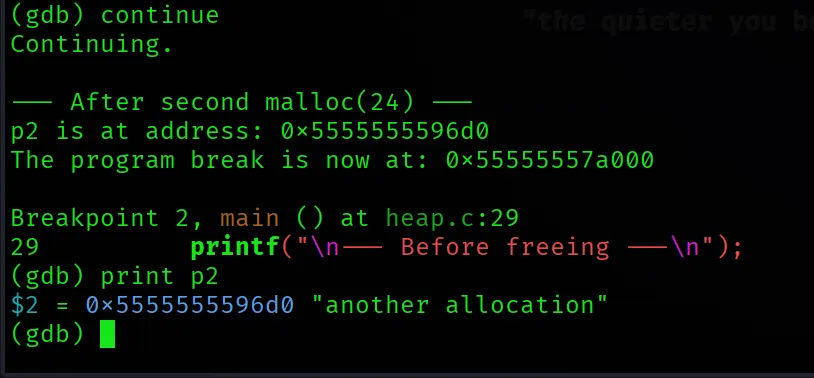
Observe the Layout. Notice the address of p2 (0x5555555596d0). The first chunk started at 0x5555555596b0 (user data) and had a total size of 32 bytes (0x20). So, 0x5555555596b0 + 0x20(32) = 0x5555555592d0. They are perfectly adjacent! The heap allocator simply placed the second chunk right after the first one.
Examine the second chunk’s header:
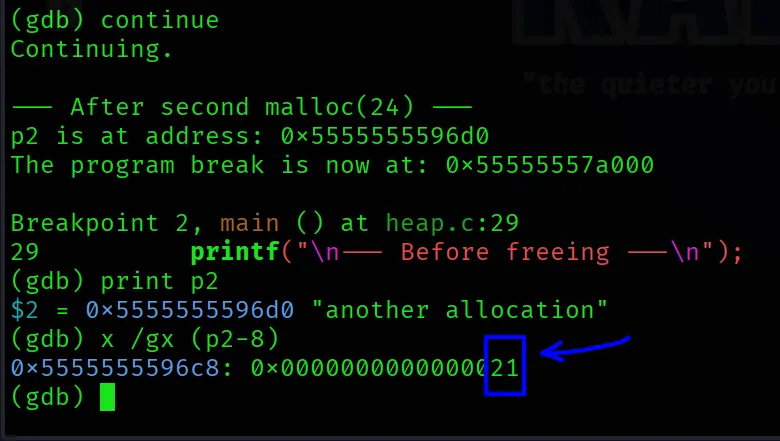
Wait, 0x21 again? We asked for 24 bytes. 24 (user) + 8 (header) = 32. And 0x20 in hex is 32.
The PREV_INUSE bit is set, so 0x20 + 0x1 = 0x21. This chunk is also 32 bytes total.
Let’s look at the memory layout of both chunks combined. We’ll examine 8 giant words (64 bytes) starting from the header of the first chunk.
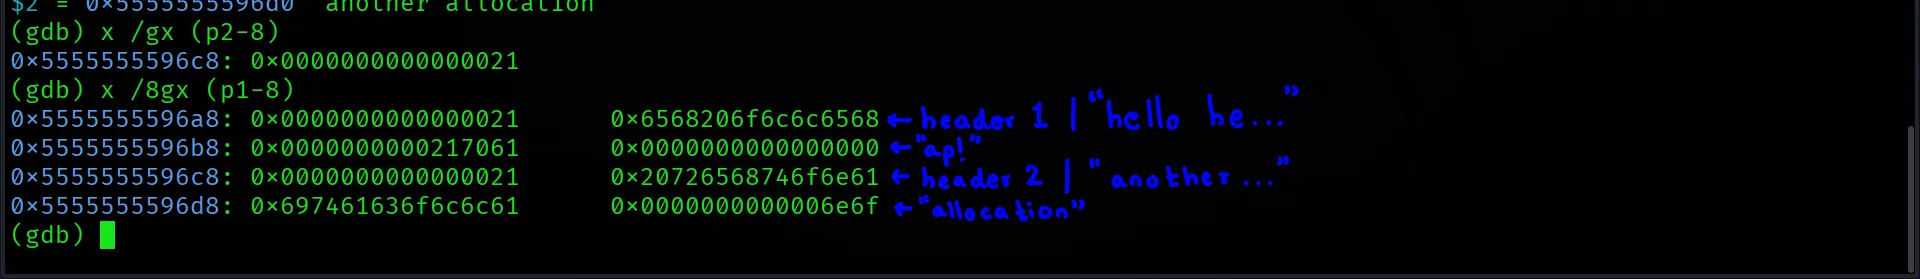
You can clearly see the header 0x21, the user data, the next header 0x21, and its user data.
Now, let’s observe what happens when we free memory.
(gdb) continueThe program stops after free(p1).
Let’s examine the first chunk’s memory area again. Modern allocators use something called a “tcache” (thread-local cache) or fastbins for small allocations. When you free a small chunk, it’s not immediately given back to the OS. It’s put on a linked list of free chunks of the same size. malloc will check this list first before asking the OS for more memory.
The free function stores a pointer to the next free chunk in the user data area of the chunk we just freed.
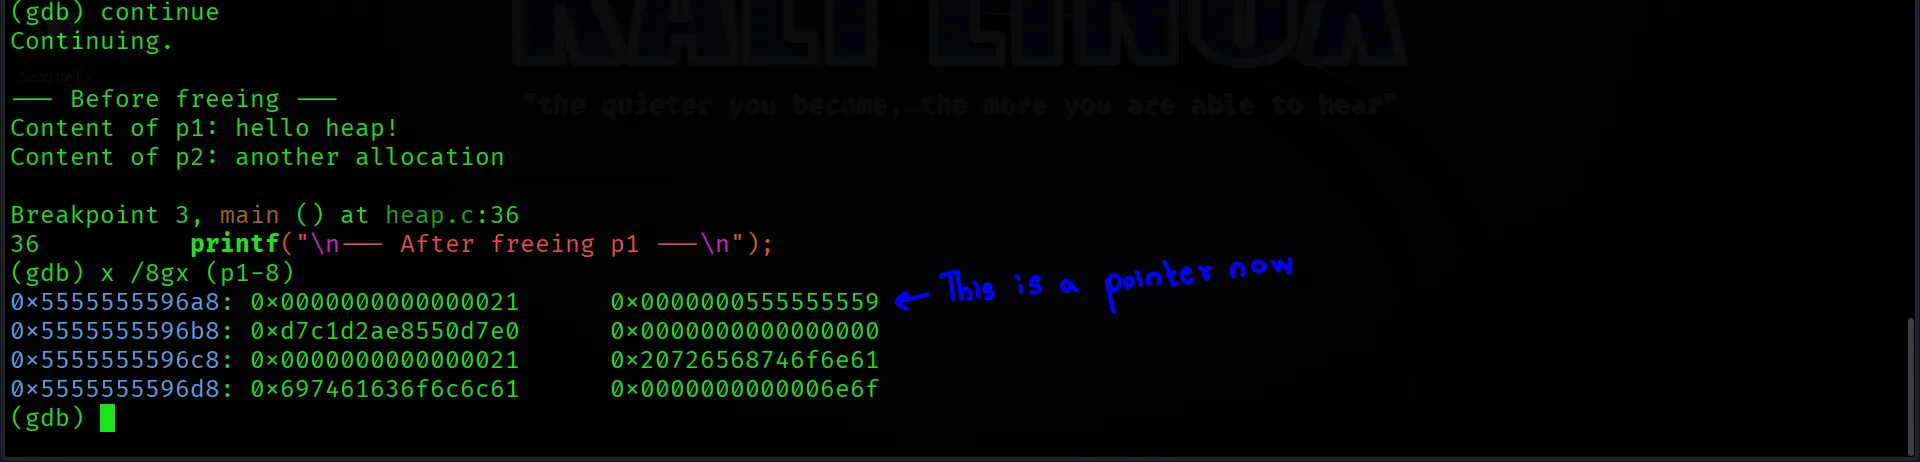
You might see the “hello heap!” data is gone, replaced by a pointer (or it might still be there, free isn’t required to clear it). The key is that the allocator now considers this chunk “free” and available for reuse. This is how a “use-after-free” vulnerability happens the data might still be there, but the chunk is marked as free.
Hit continue again:
You can continue again to let the program finish or type quit to exit GDB.
Key Takeaways:
- Heap grows “upwards”: You saw the program break address increase as we allocated more memory.
- malloc is more than a pointer: It returns a pointer to a user data area, but this area is part of a larger “chunk” that includes a header with metadata.
- Metadata is crucial: The header (containing size and flags) is stored just before the memory malloc gives you. This is how free knows how much memory to deallocate.
- free doesn’t erase: It simply marks the chunk as available for reuse, often by putting it in a “freelist”. The old data might persist until the chunk is reallocated.
- Alignment matters: malloc will often allocate more memory than you ask for to satisfy alignment requirements (usually 16 bytes on x86-64), leading to chunk sizes being multiples of 16.
Stack != Heap
The Concept at a Glance.
Let’s quickly recap what we’ve been looking for:
The Stack
Used for static memory allocation. Local variables, function parameters, and return addresses are pushed here. It grows and shrinks in a predictable LIFO (Last-In, First-Out) manner. It’s managed automatically by the compiler.
The Heap
Used for dynamic memory allocation. This is a large pool of memory available to the programmer. We must manually request memory from it (using malloc, calloc) and manually release it (free). It’s less organized than the stack, and this is what we’re going to explore.
Final Thought
The heap isn’t just “a place for dynamic memory.”
It’s a complex memory arena, full of logic, structures, and potential mistakes. And it’s waiting for you to understand or exploit it.
We’re just getting started. See you in Part 2.